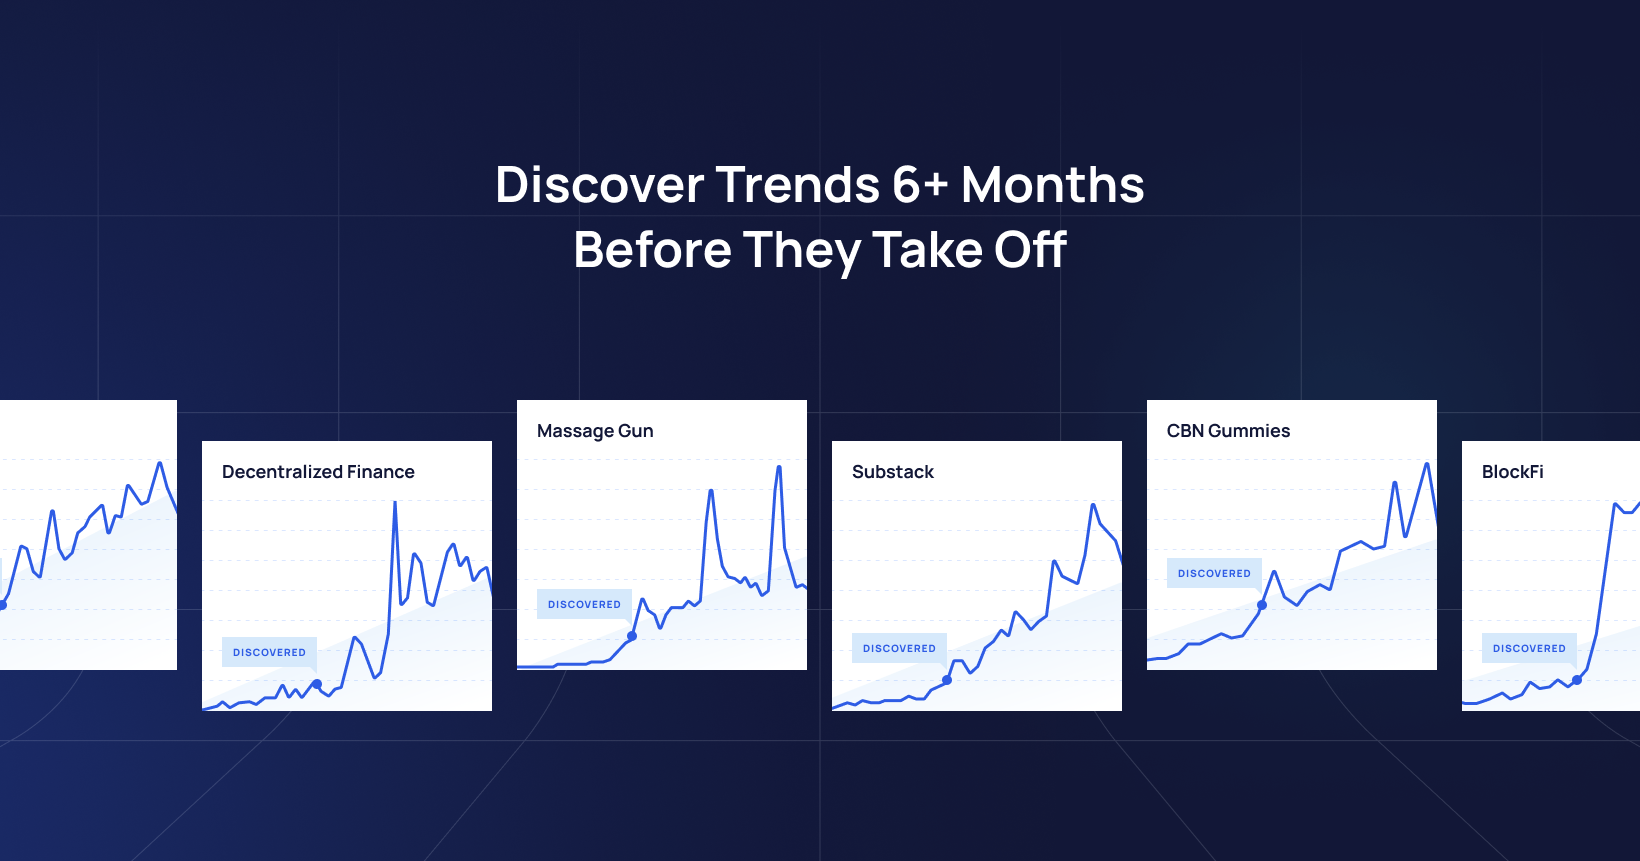
Trends Directory
Find trends of anything. For Affiliates by Affiliates.
World Monitor
World Monitor is an AI-powered, real-time global intelligence map that fuses news, conflicts, disasters, and infrastructure signals into one live dashboard.
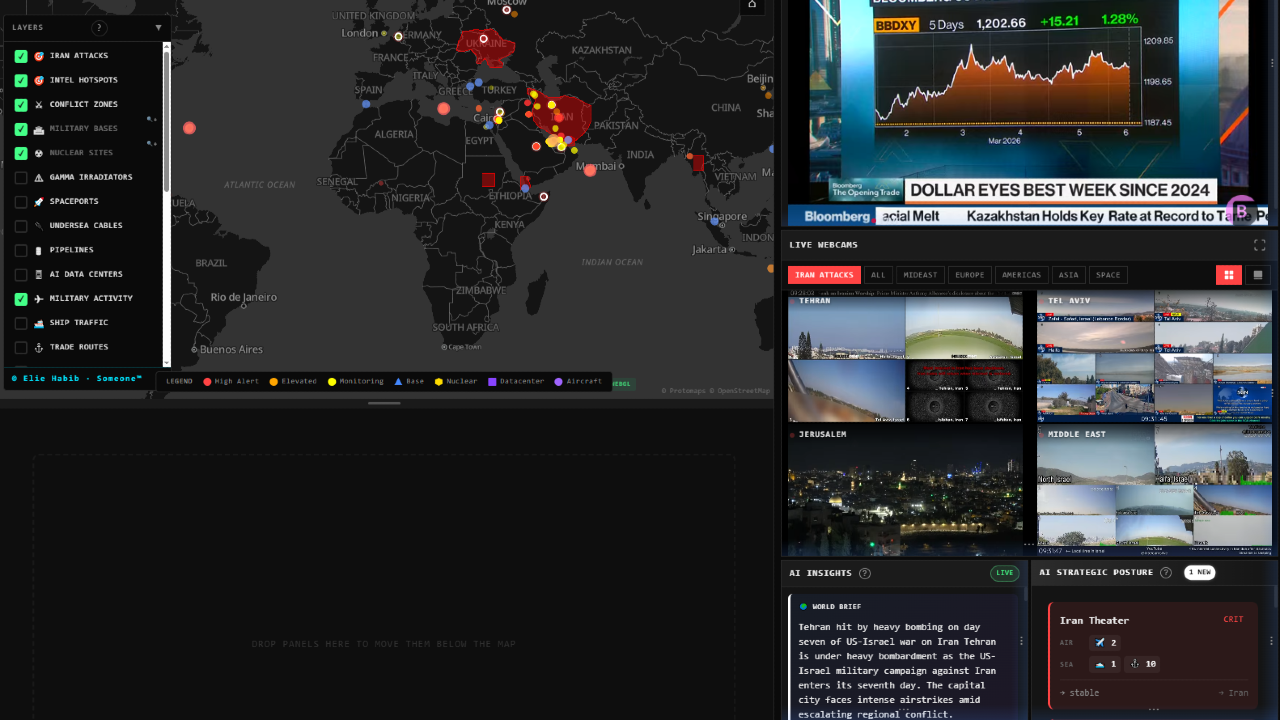
WorldMonitor.app is a real-time global intelligence dashboard that aggregates open-source data (news, conflicts, disasters, infrastructure signals, flights, ships, etc.) into an interactive world map so you can quickly see what’s happening around the globe. apps.apple
What is World Monitor?
- It pulls from 100+ public data streams: international news wires, government feeds, flight ADS‑B signals, ship transponders, satellite fire/outage data, and other OSINT sources. sourceforge
- An AI layer classifies events (military activity, protests, cyber incidents, natural disasters, etc.) and assigns severity or “instability” scores to countries or regions. sundayguardianlive
- Everything is visualized on an interactive 2D map and/or 3D globe so you can zoom into hotspots, filter by category, and inspect individual incident details. linkedin
- It is available as an open-source web/desktop experience and is also packaged as native or PWA-style apps depending on platform. webcatalog
How to use it (basic workflow)
-
Access the dashboard
- Go to the main website in a browser (worldmonitor.app) or open the packaged app if you’re using desktop/mobile. worldmonitor
-
Explore the global map
- Use mouse/touch to pan and zoom around the map or globe; hotspots are represented by pins or markers. sourceforge
- Color or icon styles usually distinguish event types like conflicts, protests, disasters, or infrastructure signals. linkedin
-
Filter by data type or region
- Toggle layers such as military flights, naval activity, protests, natural disasters, internet outages, fires, or critical infrastructure. sundayguardianlive
- Apply region or country filters to focus on specific areas you care about (e.g., Middle East, South China Sea, Eastern Europe). linkedin
-
Inspect events in detail
- Click a marker to see metadata: time, location, source links, severity, and any AI-generated summary or “intel brief.” apps.apple
- For conflicts or risk indicators, check escalation scores, convergence alerts (when multiple signals spike together), or instability indexes. linkedin
-
Use AI summaries and scoring
-
Set it up for monitoring workflows
- Keep it open as a live situational-awareness “wallboard” for markets, OSINT, geopolitical analysis, or travel/security monitoring. webcatalog
- Combine with your own alerts or watchlists (e.g., specific corridors, straits, borders, or energy infrastructure) by regularly checking the relevant layers. worldmonitor